.svg)
Konica Minolta's European IT team approached us to help them improve their customer selfservice printer management portal, which is gradually expanding across Europe. The goal of the portal is to automate and accelerate customer support. The portal works technologically, but the IT team had a legitimate feeling that it was possible to significantly advance it from a user experience (UX) perspective.
Seven members of the family participated in the project — 5 UX designers, a web analyst and a project manager.
Target
- Improve the UX of the customer portal
- Increase the competence of the internal team in the field of UX design
Impact
- We have accelerated the user's passage through the portal
- The internal team began to focus on the real needs of users
- Management gained new and proven opportunities for marketing development and customer support
Key parts of the project
Over the course of 15 months, a lot has happened and not everything has gone as we imagined at the beginning. Let's go through the key parts of the project together and their impacts.
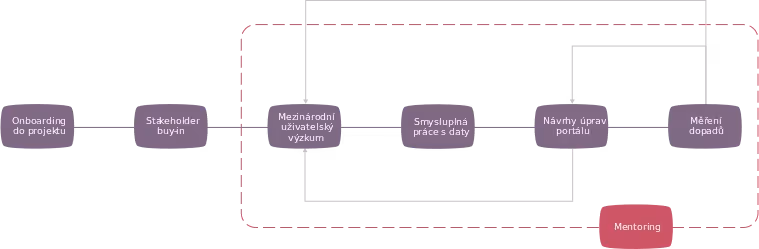
Onboarding to the project
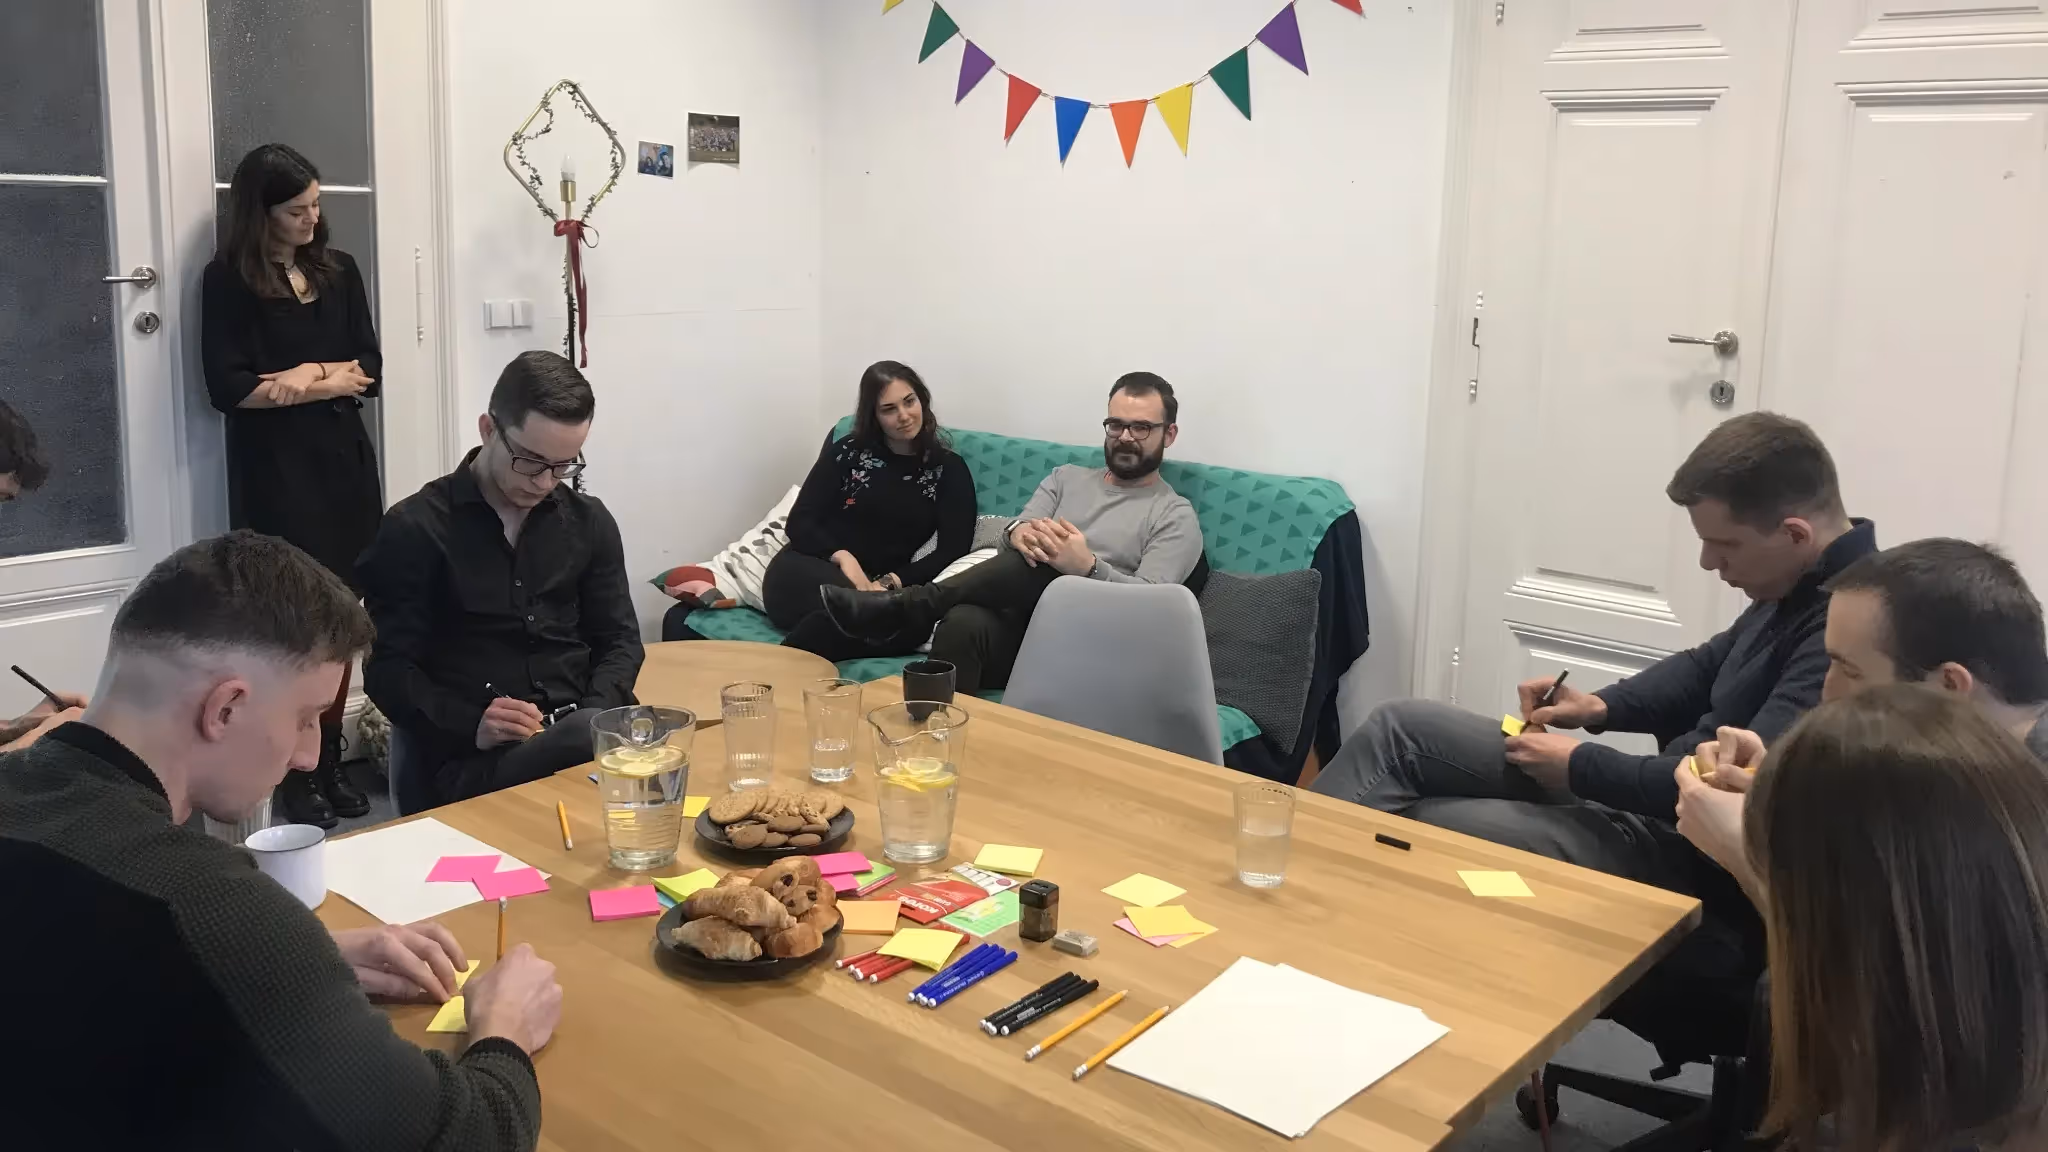
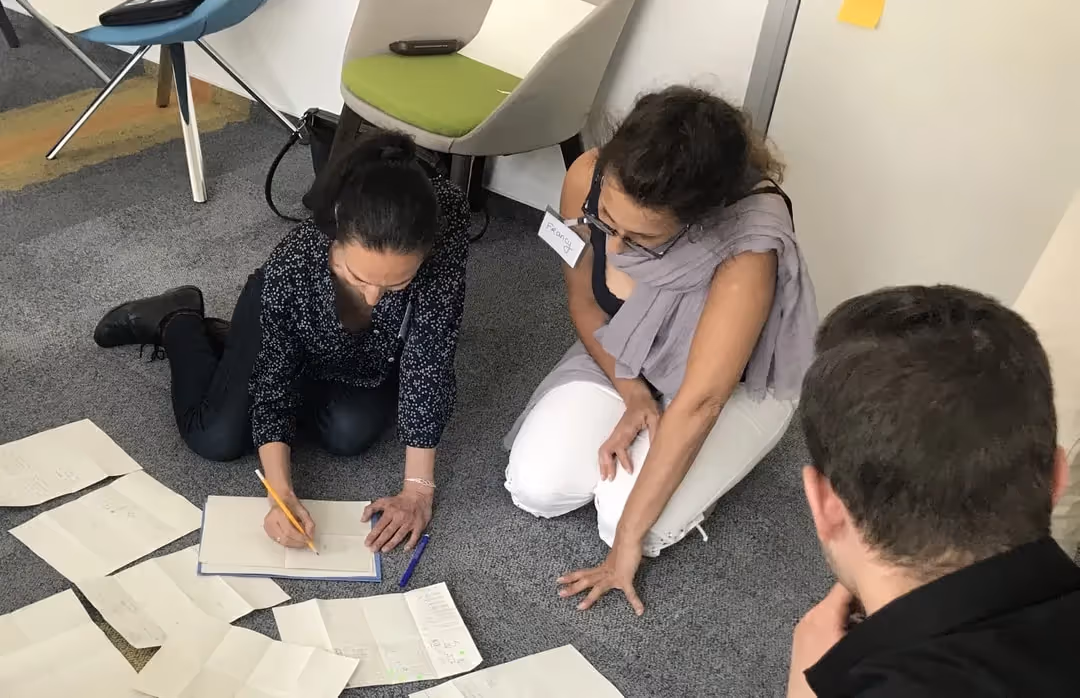
Our work always starts with understanding the client's business. Given the size of the project, we created a series of workshops to help us understand the project better and thus get all team members to the same starting line. Finally, there were five workshops:
- We framed the portal into the functioning of the business and internal processes
- We put together constraints (e.g. technological connection to other systems)
- We understood the functionality of the portal and its customizations across countries
- We have described together assumptions about the users of the portal
- We have mapped key stakeholders and their role in the project
- We set up project processes for collaboration
- We held informal meetings to bring the teams closer together
It was clear from the initial workshops that the project would be more complex than we thought. The portal helps people with one machine, as well as users managing thousands of printers. It is tailored to specific countries across Europe and uses connections to other systems.
Moreover, Konica Minolta is a large organization, so from the first workshop it became clear that we could not do without the support of key stakeholders across management. This was followed by a phase of persuasion...
Stakeholder buy-in
Our work was not only tied to the IT team, but also to support key managers across the organization. We needed different countries to help us reach users of the portal for future research and actively cooperate in the development of the portal.
So we started collecting data -- arguments why they should help us.
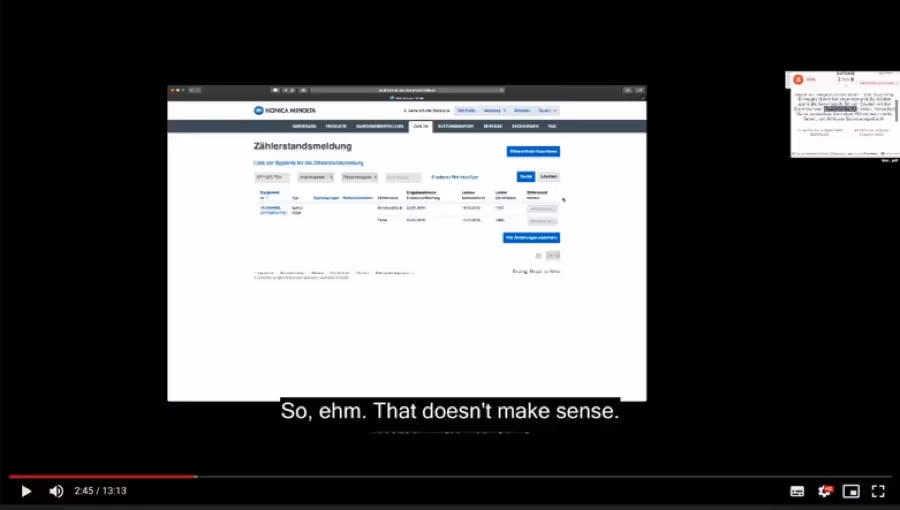
We set up detailed measurements of the entire portal and conducted initial user testing on several language mutations with internal staff. We then linked the test results with data from Google analytics and, together with colleagues from IT, presented them remotely to management. As a result, we have received the promise of cooperation and support for the project from all key countries.
We have confirmed our experience so far — if users are visibly bothered when using the site, it is difficult for management to ignore it. A few well-placed records from testing can work wonders.
International User Research
Team onboarded, managers onboarded -- it's time to get to work. Essentially, the design process has two phases — understanding the context and modeling the change. And we needed to understand in detail User Context.
Web Analytics and the online questionnaire gave us initial quantitative insights, international user testing and internal interviews allowed us to get really in-depth.
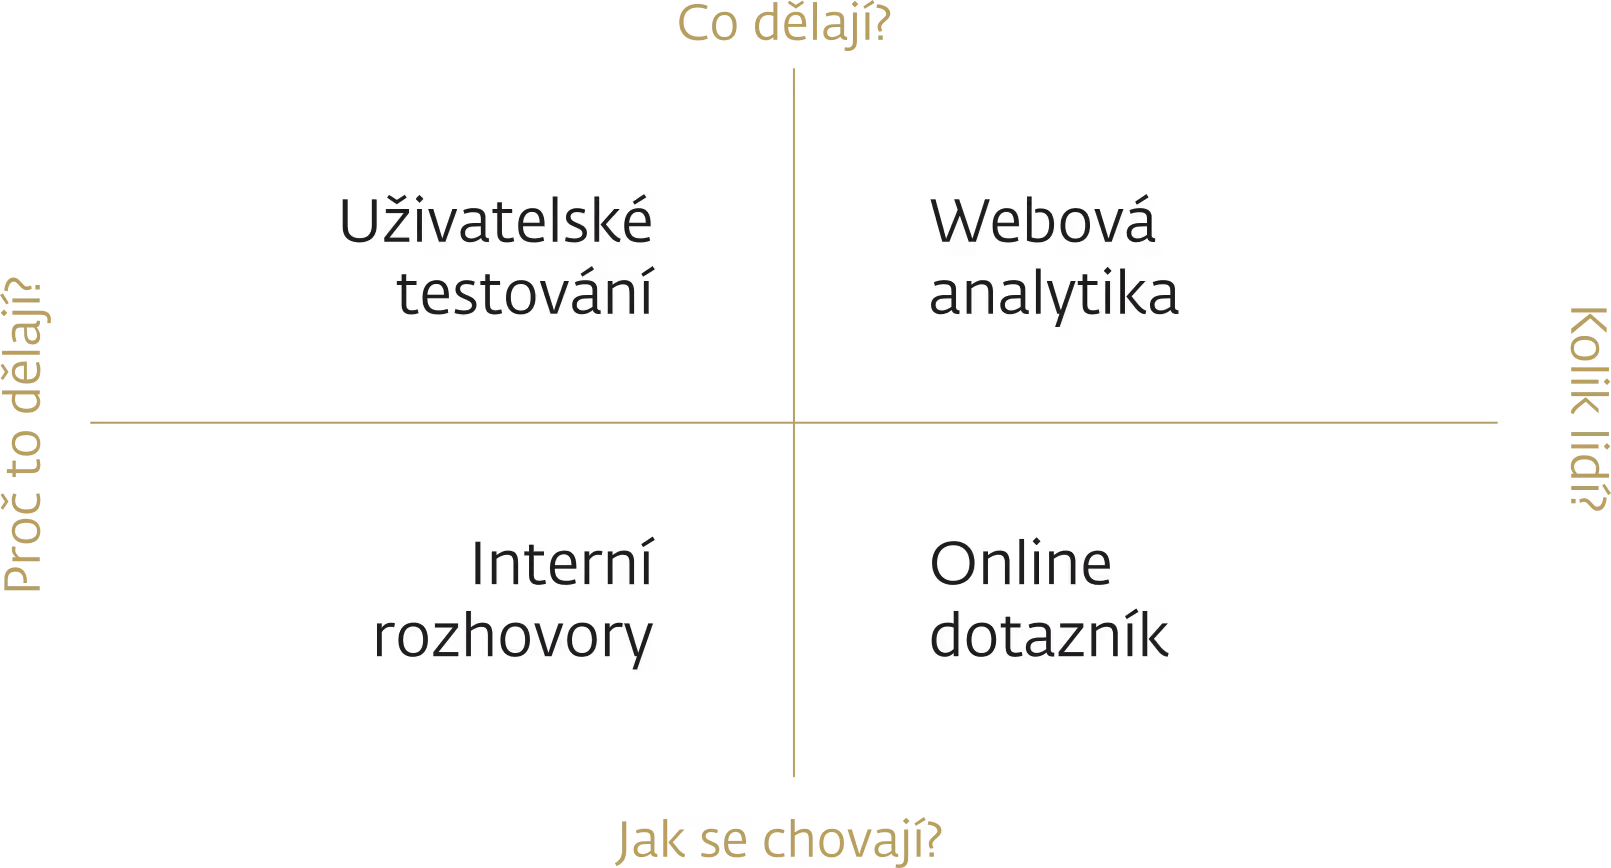
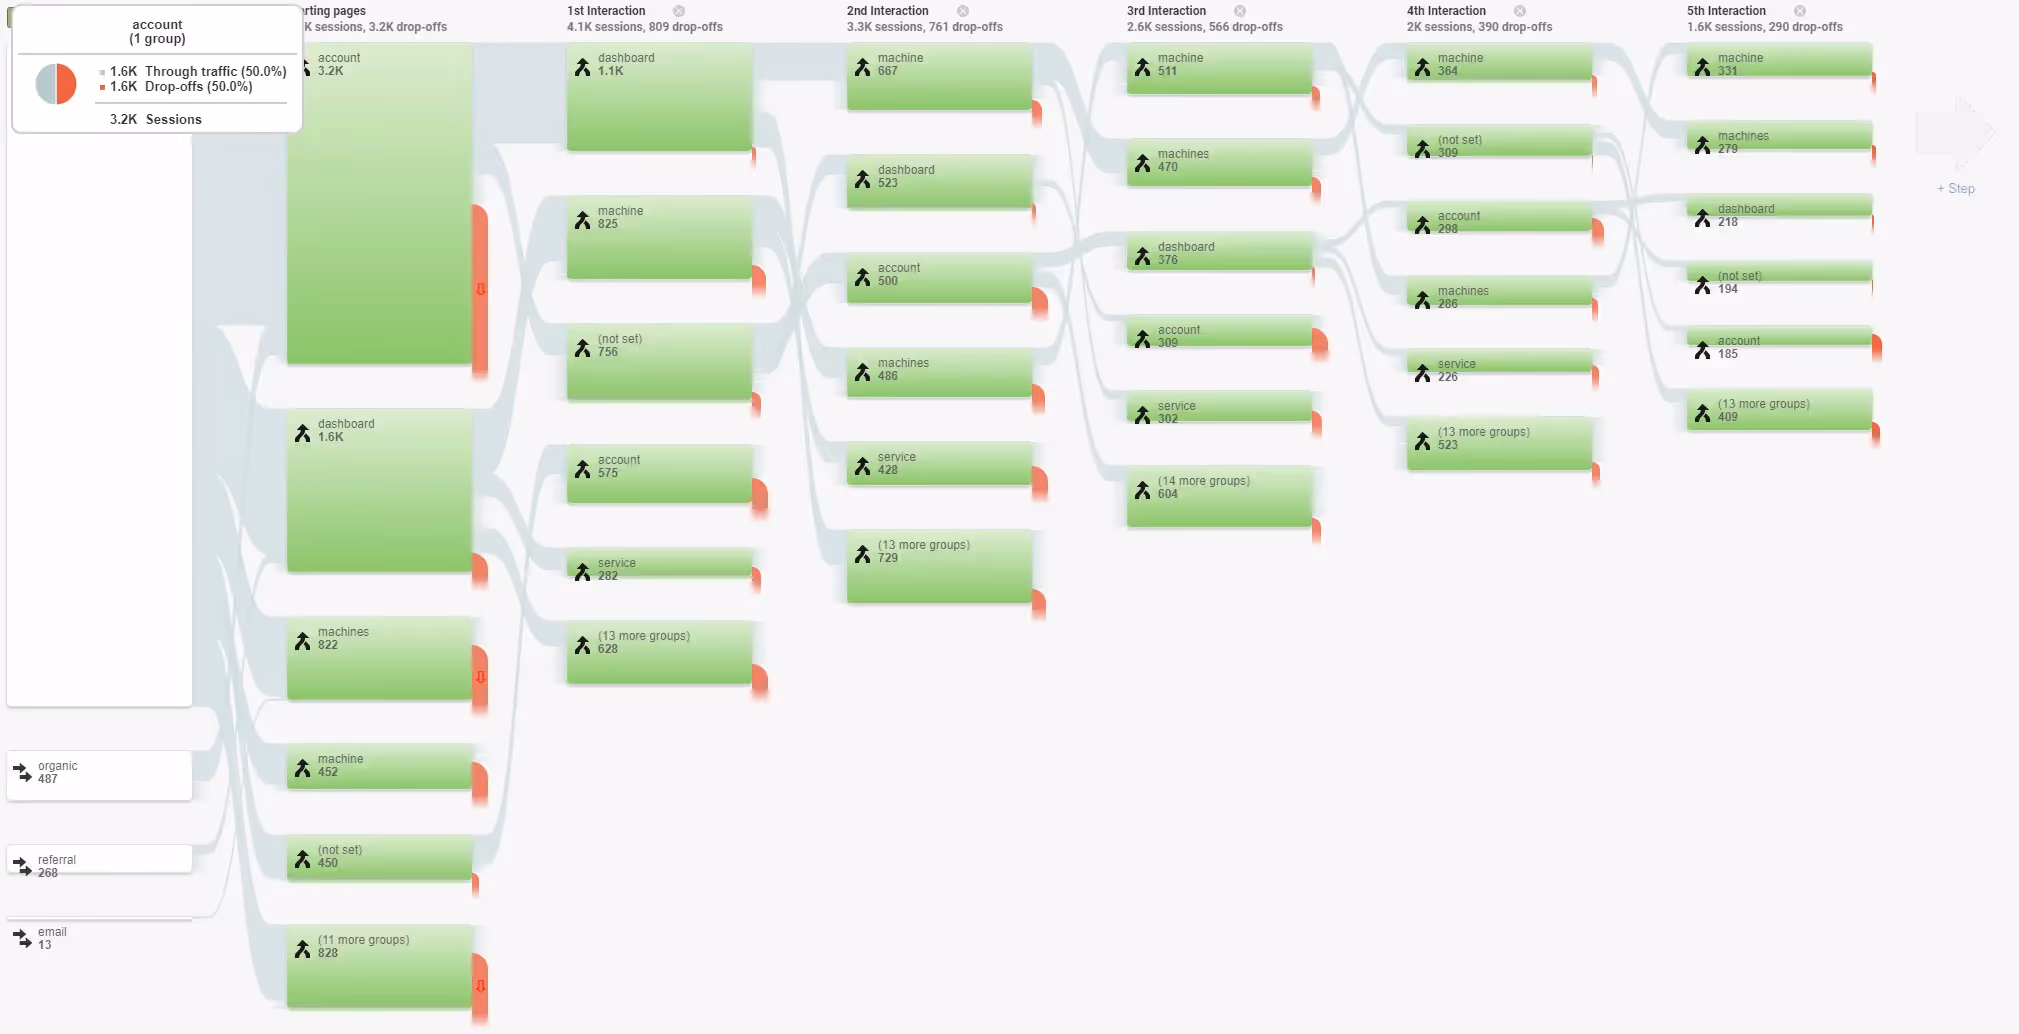
Web Analytics
Analytics helped us understand how users behave on the portal, what pages they see and vice versa, which pages and functions are completely unused. In addition, we enriched the measurements with a lot of anonymized data about users, such as how large companies use the portal, how often they use it, how new users use the portal and how existing users...
Online Questionnaire
We combined analytics with our own technical questionnaire solution based on 4Q methodology. This allowed us to identify the most common user scenarios. Heat maps and recordings of user movements around the site helped us define the main issues in the usability of the portal.
Internal interviews
We conducted internal interviews with people who are in direct contact with users, i.e. hotline operators and service technicians in different European countries. This gave us further insights into how printer management works in the field. For example, it turned out that for many people the problem is to find the portal and register in it at all. Therefore, it is easier for them to call support, or directly to a technician.
International User Testing
Over the course of three weeks, we organized large user testing of the portal in the Czech Republic, Germany, France and the United Kingdom, which proved to be a key source of data for improving the portal. We tested both the mobile and desktop versions and gained a lot of insights into how people navigate the portal and how they work with it.
Working with data
Sense-making workshop
Data is useless to you if you don't work with it. And this applies not only to the design team, but also to the key decision-makers who influence the development of the portal. So we organized a three-day international workshop, which was also attended by managers from the Czech Republic, France and Germany, and together we made sense of the collected data.
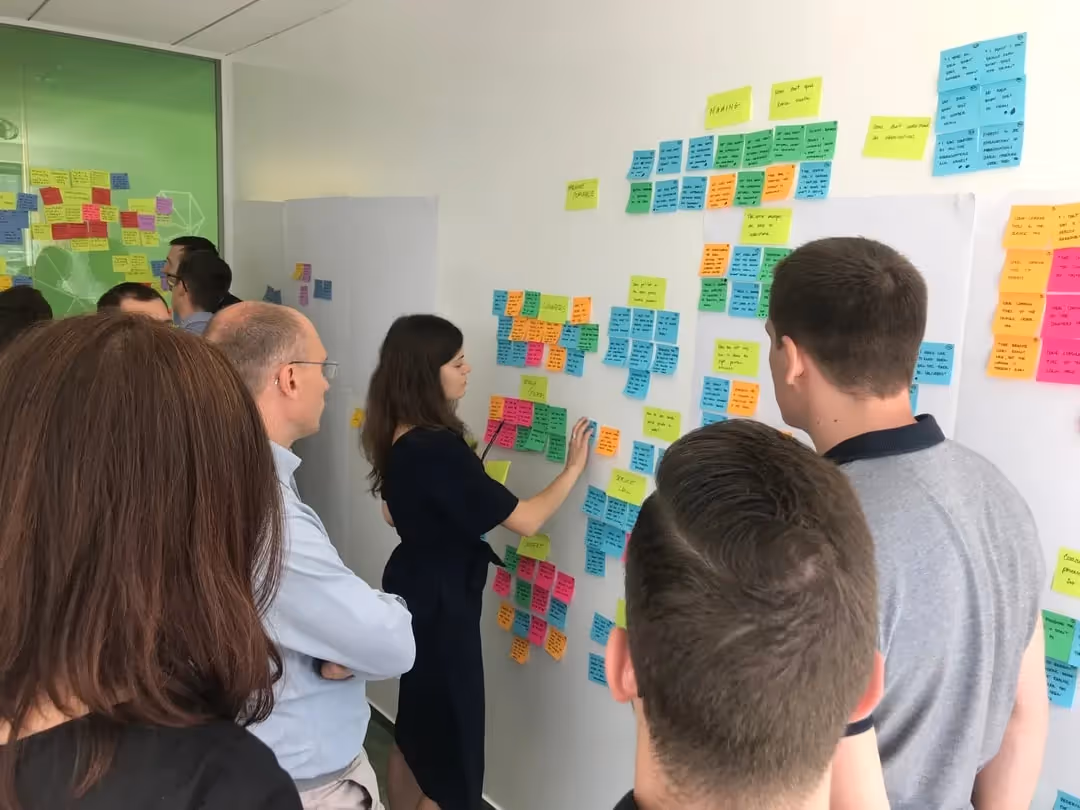
In the workshop, we identified 35 opportunities that we could focus on in our next work. Not all of them were directly related to the portal — we also found incentives to improve customer support or marketing.
Long-term work with user research
As part of the design process, we should now proceed with the design of specific solutions and testing them. We will get to that in a moment, now we are waiting for a small step aside.
We have experience that if the client does not systematically work with the data and opportunities obtained from research and does not record his design decisions, then in a few years he will solve the same problems and waste energy wastefully.
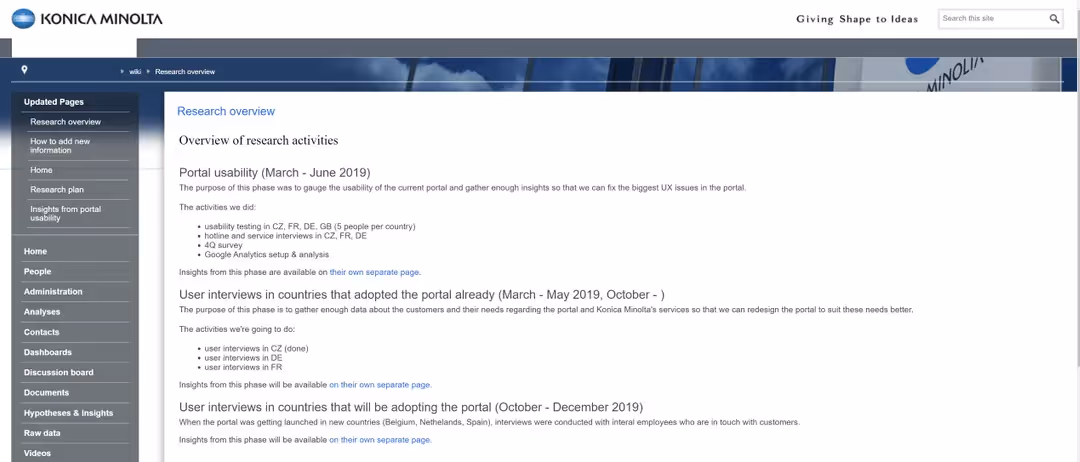
So, together with the internal team at Sharepoint, we created a User research Wiki, which became a central place for collecting all the know-how about the users of the portal and the ongoing results of the experiments. The data is thus easily accessible, systematized, continuously replenishable not only for the IT team, but also for business and marketing.
However, sharing knowledge alone will not ensure that developers will work on functionality that has real benefits for Konica Minolta. Management can push to implement their ideas regardless of any users out there.
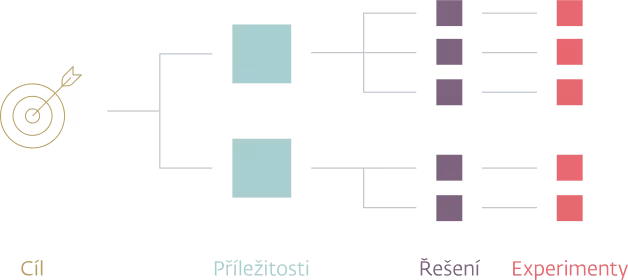
So we started working with conclusions from user research through the tool Opportunity solution tree. The latter is based on several assumptions:
- If we want to meet our business goals, the project has to solve the real problems of the people out there.
- for every problem there are multiple solutions
- benefit is not always seen ahead and assumptions need to be verified
The Opportunity solution tree connects KPIs, user research, portal development proposals and experimentation to systematically manage portal development.

Výzkumná STOPka
První vlna uživatelského výzkumu nám přinesla mnoho příležitostí pro rozvoj portálu a začali jsme je obratem využívat při hledání řešení. Nicméně v některých oblastech jsme se chtěli dostat ještě hlouběji k pochopení zákazníků a vyplnit si tak bílá místa. Naším cílem bylo i zavedení procesu, v rámci kterého budeme dlouhodobě a průběžně objevovat nové příležitosti.
I přes úspěšný pilot tohoto procesu a příslib spolupráce od klíčových zemí prvotní nadšení opadlo. Ukázalo se, že náš stakeholder buy-in nebyl dostačující a další práce v oblasti explorativního uživatelského výzkumu už se nám v průběhu projektu nepodařilo rozjet i přes veškerou snahu našeho i interního týmu.
Portal Modification Design
The design process continues — 35 opportunities found meant prioritizing, devising, sketching and implementing solutions.
We organized a series of ideation workshops and Design Studio workshops and, together with the internal team, gradually created concrete proposals to improve the portal, which we were able to design, implement and quantify the impacts relatively quickly.
An important part of the work was the participation of management and internal team in creating the solutions themselves. This allowed us to quickly prioritize solutions for implementation thanks to internal knowledge of technical and process constraints.
Above all, the participatory approach to finding solutions drew everyone into the project. As our friend Emanuel Byrtus says, “People treat ideas like children, they prefer to have their own.”
Experimentation
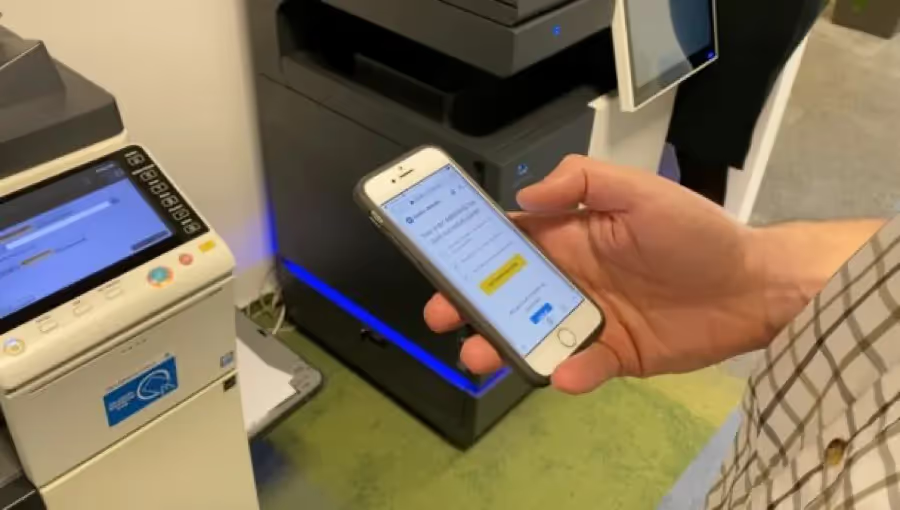
One of the proposals that emerged from the workshops was to create a quick entry feature to the portal so that users have customer support available when they need it - for example, when their printer is not printing.
Before embarking on the development of functionality, we proposed a series of quick experiments that, at minimal cost, managed to answer the questions: “Is anyone even interested in this? Can people use it?”.
These experiments had several positive effects:
- we rejected our initial proposal, and after it several others
- after a few rounds we came to a much better solution
- in a timely manner, we have detected links that are not directly related to the portal — e.g. marketing of a new function, processes on the customer support side, etc.
- we changed not only the whole concept of the function, but also the passage of the visitor through the portal
In a complex environment, you just never know what will actually work. Experiments help to uncover irrelevant assumptions and quickly improve solutions without the need for large investments.
Web Analytics
The detailed Google Analytics, Google Tag Manager and Hotjar helped us from multiple angles:
- we understand the behavior of people on the portal
- we could prioritize the solution because it makes sense to work on parts of the portal that are used by a larger number of users
- analytics allowed us to do quantitative experiments and tests
- we were able to evaluate the effects of modifications on the key metrics of the portal in the long term
The key metrics, i.e. KPIs, have been set since the initial workshop and they were clear and logical for us. In the course of the project, however, we found that we can only partially influence them, and their fulfillment requires the activity of multiple departments.
In the same way, we underestimated the impact measurement of each modification at the beginning — the first interventions in the portal were not sufficiently measured. As a result, during the project, a standardized process of revision of measurements after deployment of a new release and measurement of the benefits of modifications was created.
Mentoring and Team Education
Part of the project was not only the work on the portal, but also the improvement of the design competencies of the internal team. At the beginning of the project, we prepared a series of trainings on the design process, user research and analytics, and followed up with mentoring throughout the project.
The internal team thus tried key methods of user research, ideation, user interface design, testing and experimentation or evaluation of data from Google Analytics.
For mapping and subsequent development of the team's competencies, we used Mapping Maturity.
Results of the project
Bottom line. After more than a year of work and 2000+ hours worked, we have delivered:
Improved portal
- We accelerated the user's passage through the portal by 1 minute
- We have changed the team's approach to the development of the portal so that it reflects the real needs of users more
A more qualified internal team
- We have increased the IT team's design competencies in user research, ideation, sketching and idea testing
- The team began tracking the data and evaluating the effects of the modifications
New Business Opportunities
- Management got its hands on new and proven opportunities for marketing and customer support development
- Redesigned the platform for communication between key stakeholders across countries

Konica Minolta customer portals are crucial to the customer experience. This is why European stakeholders put more demands on them than can be realized.
Thanks to excellent cooperation with House of Řezač, we initiated fundamental changes in company culture and advanced team competencies in UX design and product management. We started to do user research, team up to find more possible solutions, better prioritize, iteratively experiment, measure and evaluate the benefits of portal modifications.
